No one wants to work when they are unhealthy. The same goes for containers. Why should containers serve traffic when they are NOT healthy enough? And this is where OpenShift Health Checks plays a critical role.
OpenShift Health Checks using Liveness and Readiness probes provides the perfect tool to make sure the incoming traffic is routed to healthy pods. And if you are still wondering why to worry about the containers, you will want to worry about your consumers. After all, if you send a client/consumer request to an unhealthy pod, your users are liable to get a terrible user experience.
Definitely, you don’t want that to happen in a production application.
In this post, we will learn how to implement health check for our dummy NodeJS application that we deployed in the previous post. Also, we will learn how to configure Readiness and Liveness probes in OpenShift.
So without wasting more time, let’s get down to business.
1 – Adding Health Endpoint in NodeJS Application
The requirement of a health check endpoint is quite simple. Basically, when you hit that endpoint, it should return a HTTP status code of 200. That will only happen if the application is up and running properly.
In case the application is down for some reason, the endpoint will return HTTP Status Code of 404. In other words, NOT FOUND.
Unless your application health check needs some additional logic, it is usually enough to create one endpoint that returns status code 200.
We will do the same in our NodeJS demo application. Below is our index.js file.
const express = require("express");
const app = express();

app.get("/", (req, res) => {
  const html = `<h1>Hello World from our OpenShift NodeJS App</h1>
  <p>My Pod Name: ${process.env.MY_POD_NAME}</p>
  <p>My Application Name: ${process.env.MY_APPLICATION_NAME}</p>`;

  res.status(200).send(html);
});

app.get("/health", (req, res) => {
  const html = "<h1>Application is Healthy</h1>";

  res.status(200).send(html);
});

app.get("/unhealthy", (req, res) => {
  const html = "<h1>Application is Unhealthy</h1>";
  res.status(404).send(html);
});

app.listen(8000, () => {
  console.log("Application is listening to requests on port 8000");
});
You can notice in the above code that we have created two endpoints. The first one is /health that returns a status code of 200. The other one is /unhealthy that explicitly returns a status code of 404. Please note that you would never create /unhealthy in a real production application. This is just for demo purpose.
Also, we are using Express framework over here. Therefore, we have to run the command npm install express to install the appropriate packages.
Once our application, we can deploy this application to OpenShift. In case you are not sure how to do that, you can refer to the OpenShift NodeJS Deployment post.
2 – Configuring Readiness and Liveness Probes
Once we deploy our code into OpenShift, we can now setup the Readiness and Liveness Probes.
To do so, we have to click on the Deployment Config of our application. Then, we can click on Actions button (top right corner) and select the option Edit Health Checks from the dropdown.
This will open a dialog box as below:
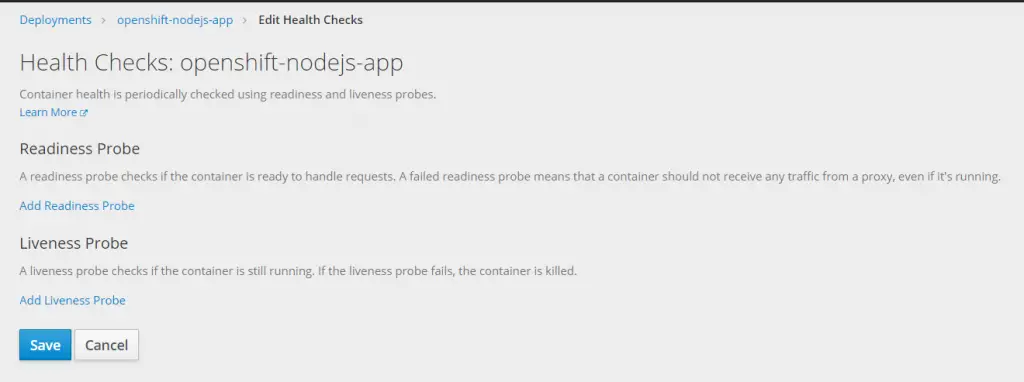
As you can see, there are two probes available for us to configure:
Readiness Probe – This probe checks if the container is ready to accept incoming traffic. In case a readiness probe fails, OpenShift will stop all traffic to that pod.
Liveness Probe – This probe checks if the container is still running. In case the liveness probe fails, the container is killed and restarted.
2.1 – Using Unhealthy Endpoint
First, let’s use the /unhealthy endpoint in our configuration and see what happens.
To setup the respective probes, you can click on Add Readiness Probe and Add Liveness Probe buttons and fill the details as below:
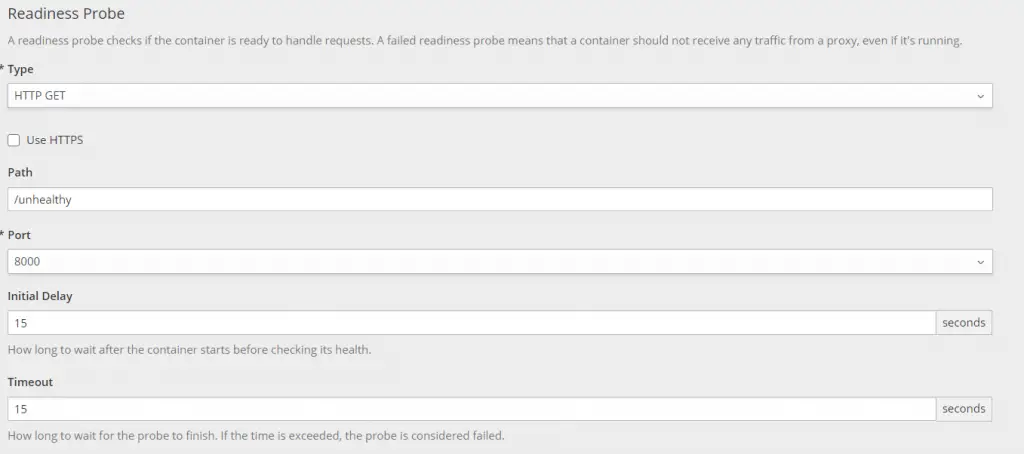
Below is the readiness probe detail:
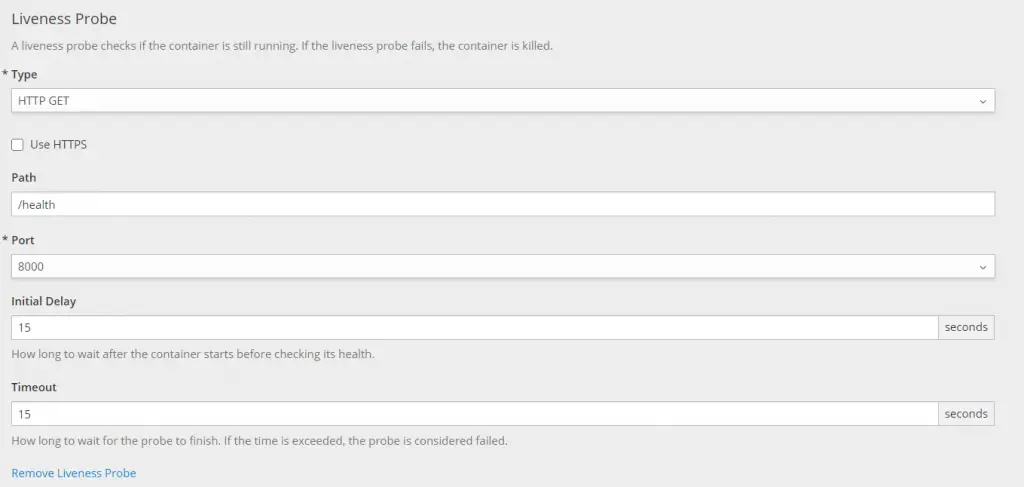
Next is the liveness probe:
Some of the properties in the dialog box are as follows:
- Type – This pertains to the protocol for the health check. OpenShift provides 3 options such as HTTP, TCP and Command Execution.
- Path – This specifies the path of the health check endpoint.
- Port – This specifies the container port on which the application is running. In our case, the application is running on port 8000 and hence that should be entered.
- Initial Delay – This specifies the initial delay seconds before OpenShift tries to ping the health check endpoint.
- Timeout – This last property specifies the duration for the overall probe.
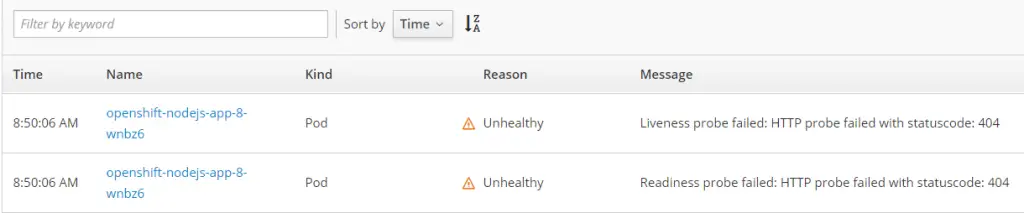
Once it is saved, a new deployment is triggered. After the timeout period is over, we can see a failure in the event log as below:
2.2 – Using the Actual Health Endpoint
Now, we can check the Path value in both the readiness and liveness probes to the actual /health endpoint. All other details can remain the same.
Once we save the change, another deployment will trigger. However, this time, after the specified duration, the new pod will start up successfully and then the old pod will be killed by OpenShift.
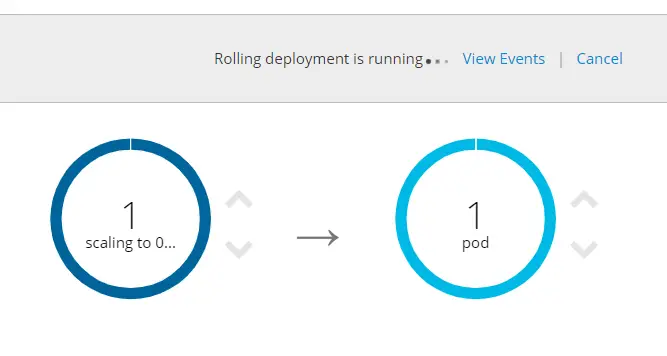
Since the new pod passes the health check, OpenShift will start routing traffic to it.
Conclusion
With this, we have successfully configured OpenShift Health Checks in our deployment using readiness and liveness probes.
We also looked at the various options available while setting up the Readiness and Liveness probes.
0 Comments