Terraform makes it easy to represent your infrastructure in the form of code.
But many times, a pictorial representation is far better when it comes to communicating with a bigger audience.
I faced a similar situation when presenting the infrastructure of my prod application to other team members. Though everyone appreciated the code, they wanted to have a visual representation of our configuration and execution plan
Thankfully, Terraform makes it quite easy to visualize the execution plan for the infrastructure by using the Terraform Graph utility.
1 – Sample Terraform Infrastructure Code
Here’s the code that we will try to visualize.
provider "aws" {
    region = "us-west-2"
    profile = "terraform-user"
}

data "aws_ami" "ubuntu" {
    most_recent = true

    filter {
        name = "name"
        values = ["ubuntu/images/hvm-ssd/ubuntu-focal-20.04-amd64-server-*"]
    }

    owners = ["099720109477"]
}

resource "aws_instance" "hello_aws" {
    ami = data.aws_ami.ubuntu.id
    instance_type = "t2.micro"
    tags = {
        Name = "HelloAWS"
    }
}
This is a pretty simple Terraform configuration file. You can read more about how it works in this post on Terraform AWS EC2 configuration.
All we are trying to do is create an AWS EC2 instance using a particular AMI.
By the way, if you are interested in Cloud Native and Infrastructure topics, you’d love the Progressive Coder Newsletter. Every week I explain a concept in a fun and interesting manner so that you never forget it.
2 – Terraform Graph command
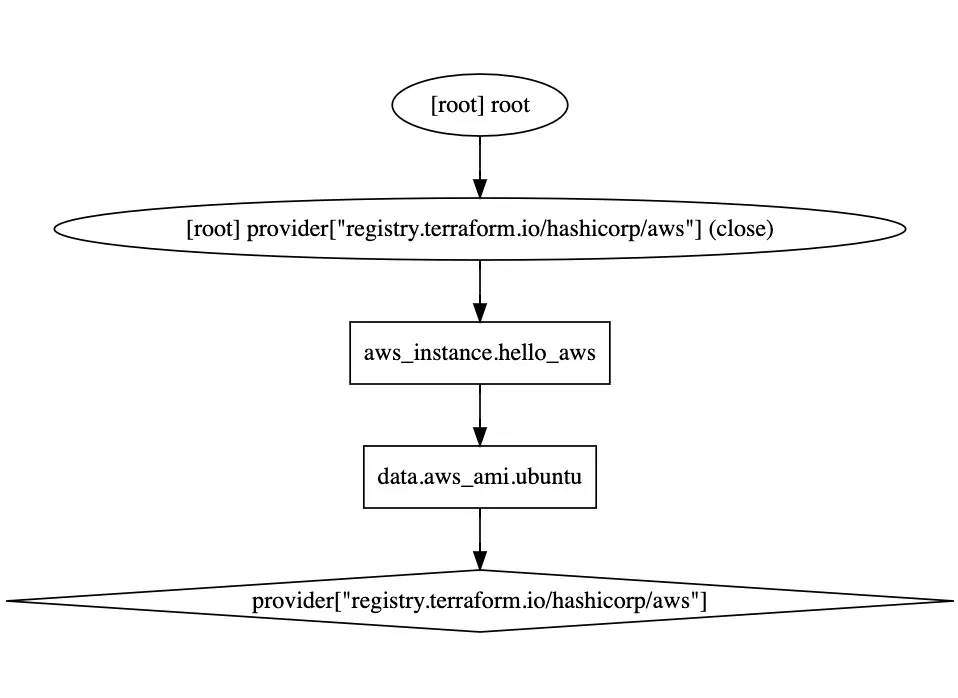
We can now use the terraform graph command to generate the visual execution graph of Terraform resources.
The graph is outputted in DOT format. You can read this format in GraphViz but many web services are also available to read this format.
See the below output from the terraform graph command.
saurabhdashora@Saurabhs-MacBook-Air terraform-aws-ec2-demo % terraform graph
digraph {
	compound = "true"
	newrank = "true"
	subgraph "root" {
		"[root] aws_instance.hello_aws (expand)" [label = "aws_instance.hello_aws", shape = "box"]
		"[root] data.aws_ami.ubuntu (expand)" [label = "data.aws_ami.ubuntu", shape = "box"]
		"[root] provider[\\"registry.terraform.io/hashicorp/aws\\"]" [label = "provider[\\"registry.terraform.io/hashicorp/aws\\"]", shape = "diamond"]
		"[root] aws_instance.hello_aws (expand)" -> "[root] data.aws_ami.ubuntu (expand)"
		"[root] data.aws_ami.ubuntu (expand)" -> "[root] provider[\\"registry.terraform.io/hashicorp/aws\\"]"
		"[root] provider[\\"registry.terraform.io/hashicorp/aws\\"] (close)" -> "[root] aws_instance.hello_aws (expand)"
		"[root] root" -> "[root] provider[\\"registry.terraform.io/hashicorp/aws\\"] (close)"
	}
}
You can copy this code into the GraphViz Online viewer and see the visual representation.
Alternatively, you can also generate the visual representation using the below command.
$ terraform graph | dot -Tsvg > graph.svg
This will create a file named graph.svg that you can view in any browser. Of course, you need to have GraphViz installed on your system for this to work.
3 – Terraform Graph Options
The terraform graph command provides a bunch of options that you can use to customize the output.
Here are a few important options:
plan=tfplan– Used to render the visual graph using a special plan file instead of the configurationdraw-cycles– This command highlights any cycles in the graph with colored edges.type=plan– Type of graph output needed. Values can beplan,plandestroy,apply,validate,input,refresh.
Conclusion
Terraform graph command is a great way to put together a quick visual view of your configuration’s execution plan.
I have used it countless times to provide better documentation for the Terraform configuration.
If you have any queries or comments about this post, please feel free to mention them in the comments section below.
Terraform is a fundamental pillar in my Cloud & Backend learning path. To know more, simply subscribe to the Progressive Coder newsletter.
Anyways, before we end this post, a quick reminder about the Progressive Code Newsletter where I explain Cloud & Infrastructure concepts in a fun & interesting manner so that you never forget what you’ve learned.
I’m 100% sure you’d love it.
Subscribe now and see you over there.
0 Comments